Guide
Understanding planning and replenishment
Read the buy plan, understand recommended-vs-order quantity, and override a forecast when you know something the system doesn't.
Plan → Replenishment is the worklist that answers "what do I need to order, and when." It exists because a decision table alone tells you what's low — the buy plan tells you what to actually do about it.
The buy plan
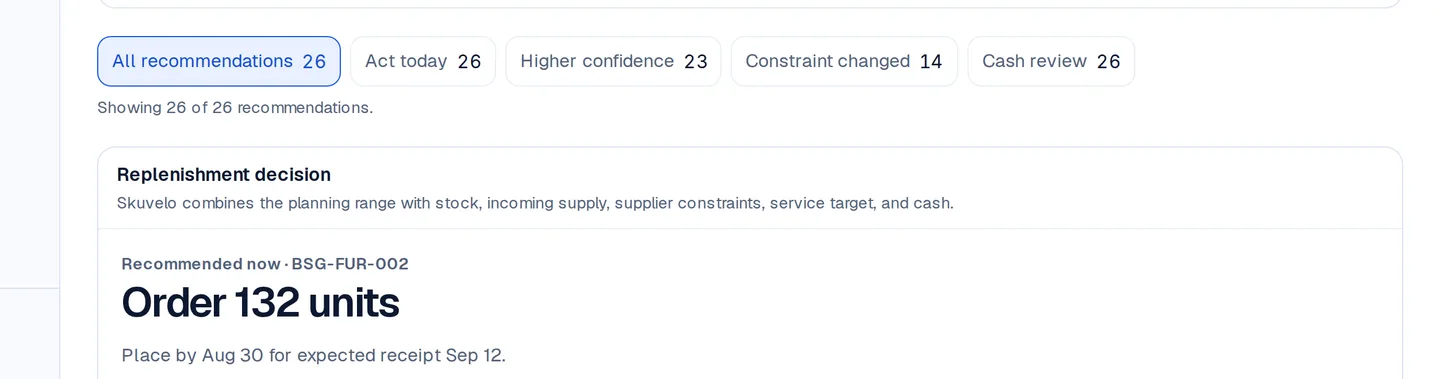
The grid lists every SKU that needs ordering, worst deadline first, alongside a recommended order quantity and any constraint that shaped it. Constraint copy is specific rather than generic — you'll see things like "Raised to supplier minimum order quantity of 24" or "Rounded up to order multiple of 6," so a number that looks odd usually has a stated reason next to it. When a SKU has no minimum order quantity or reorder floor set, Skuvelo proceeds with its own recommended number rather than blocking on a constraint that was never configured.
The Order quantity box is empty by default, which means "Skuvelo's number applies." Type your own quantity and press Enter to override it for that order — your number goes on the draft PO instead, and it's yours until you clear the box again. The row's cost, protected sales and days of cover then describe your order, and so do the plan's totals. Skuvelo's own number stays visible beside it. A product whose reordering is paused orders nothing, so it shows no cost, and its cover counts only the stock available now plus receipts due within the lead-time and target-cover window.
Override the forecast when you know better
When you know something the sales history doesn't yet — a promotion, a new listing, a trend — open Plan. Each item has one column per month; type your own number into the months you expect to be different. Each month stores exactly what you typed, and the weekly view spreads it evenly over the month's days, so the weeks always add back up to your month.
For a change across many months at once, pick a tool from the grid's menu — grow or shrink by a percent a month, or a seasonal swing. It shows the new months before you apply them, and fills in the why for you to edit. Clearing a month hands it back to Skuvelo's own number.
From an item's own page you can also enter a manual estimate. The editor states the system's own baseline (for example, "about 61.5 units/week") next to it, so you can see exactly what you're replacing before you save.
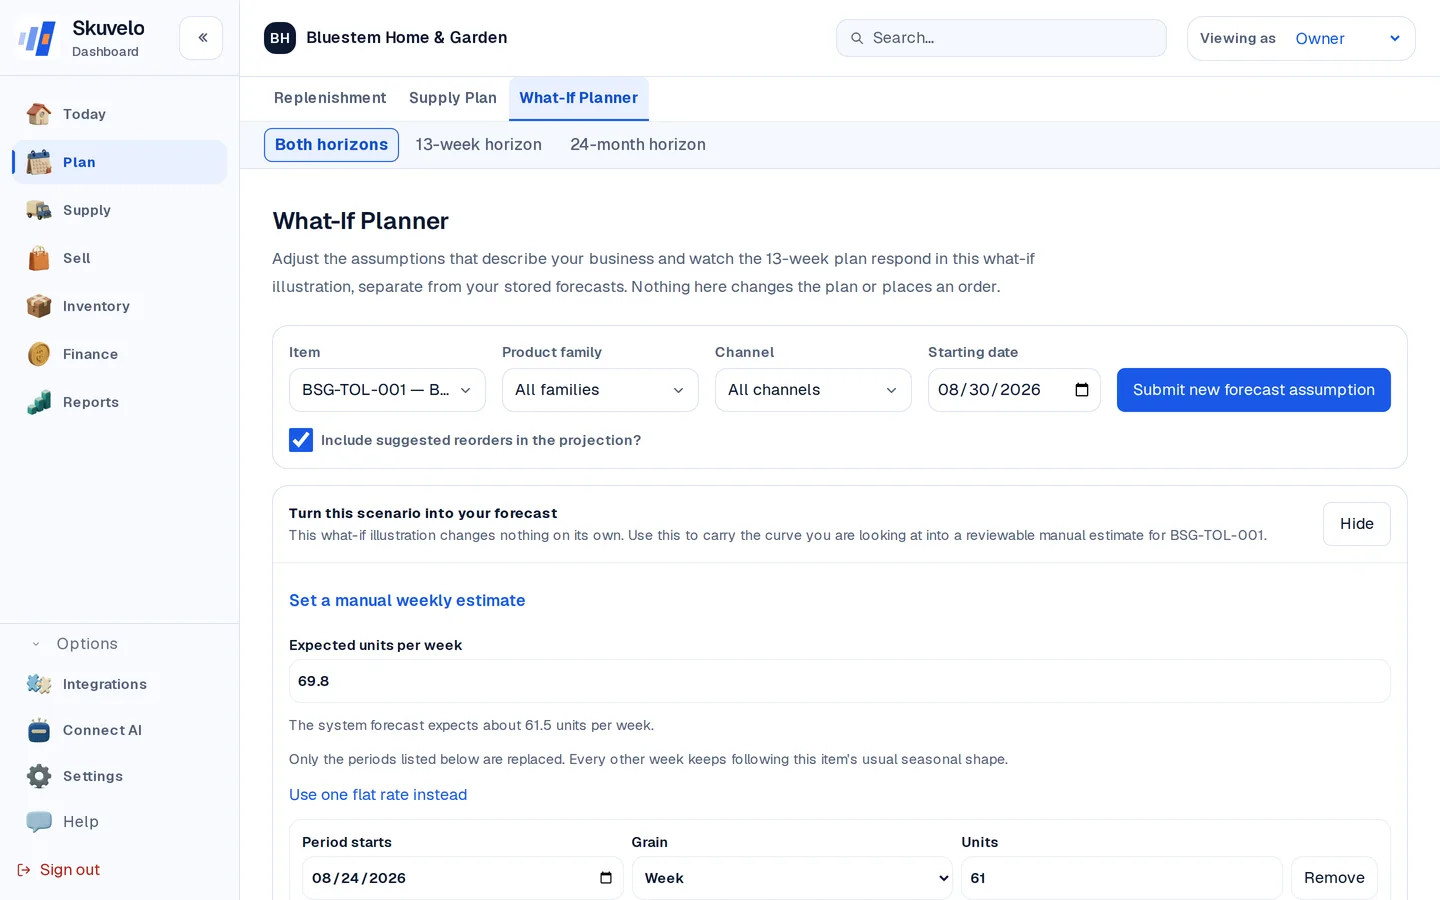
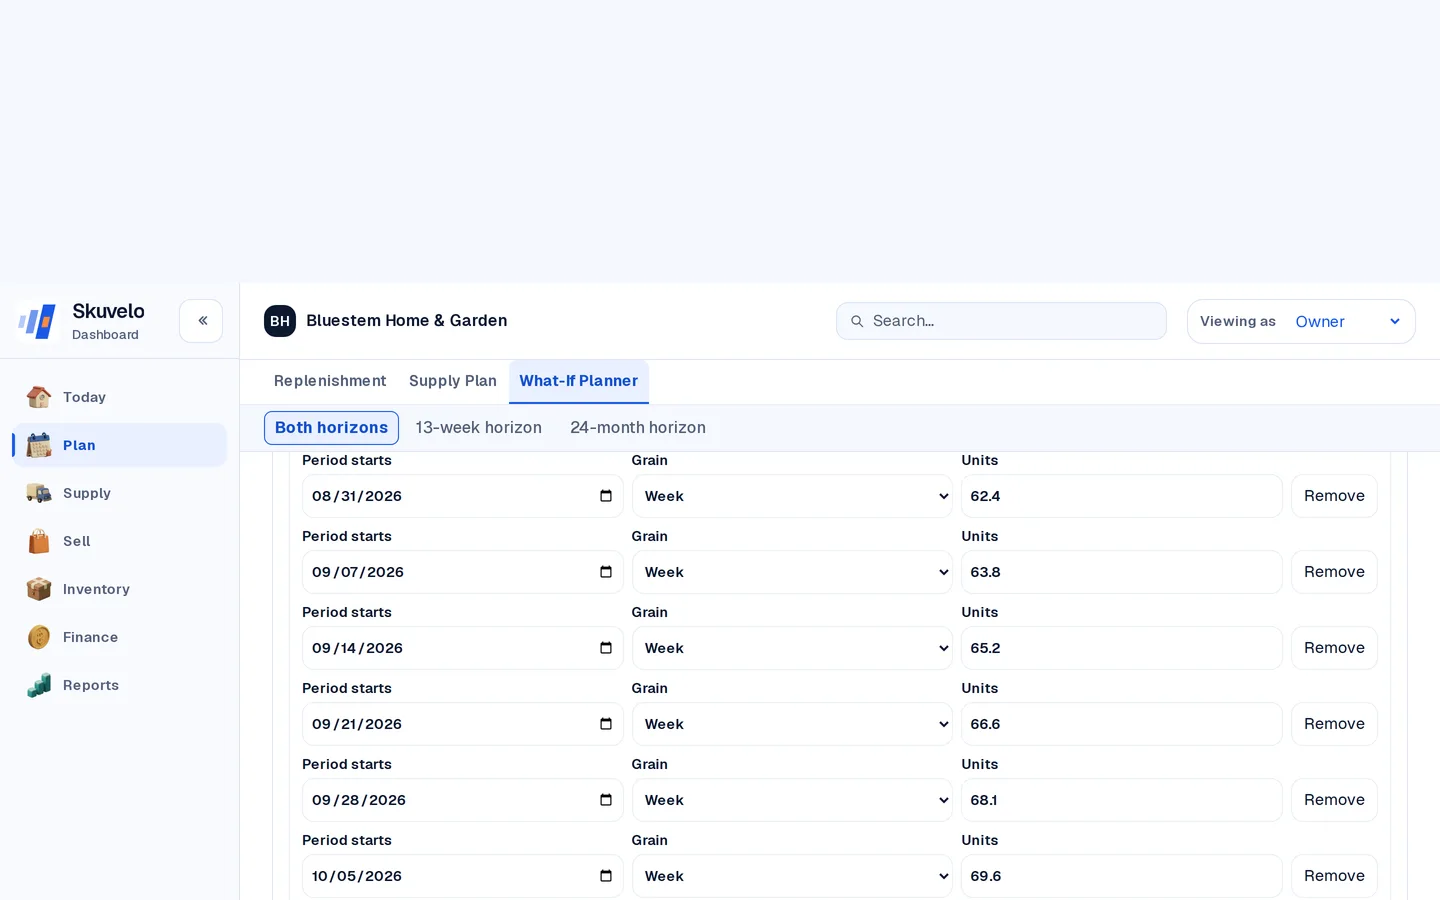
Give your change a reason — it's stored with the estimate for anyone else on your team who looks at this SKU later — and save. Planning starts using your number immediately.
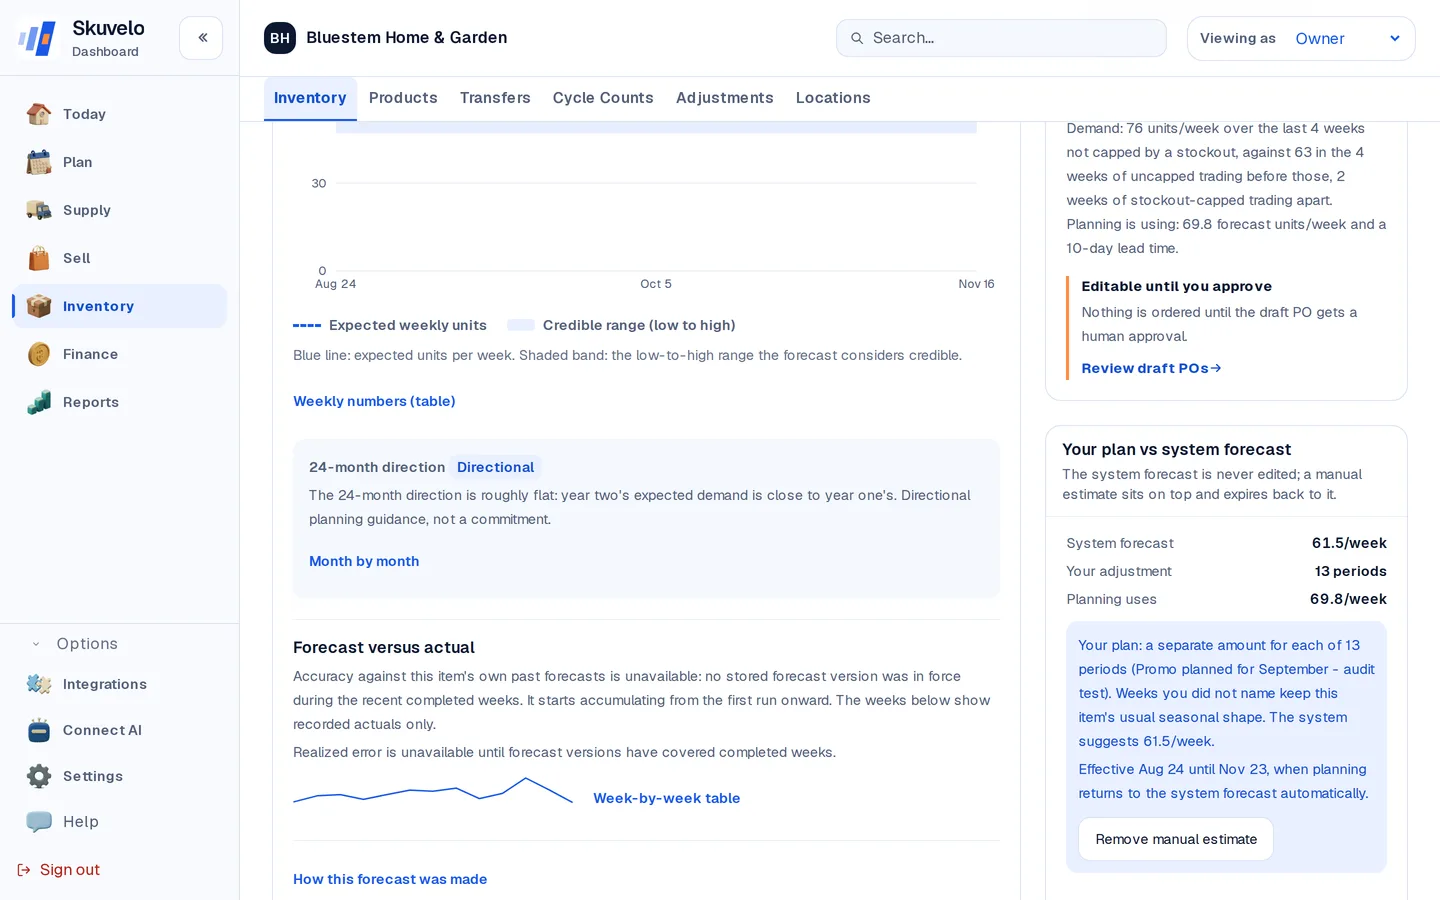
Once saved, the item's own page always shows your number next to the system forecast: what the system suggests, what you set, why, and until when.
What the numbers mean
- Recommended quantity is Skuvelo's own number, computed from demand, lead time, and any constraint. It's the number used whenever your own Order quantity box is left empty.
- A manual estimate replaces the demand forecast the recommendation is built from — it's a different lever from typing a one-off order quantity, and the two can be used independently or together.
- Constraint call-outs describe what changed the raw number and by how much, so a recommendation that looks surprising is explainable from the same screen rather than something you have to take on faith.
Read the demand view
The Supply plan's Demand tab shows three lines for each product type, month by month: Forecast, the range Skuvelo expects to fall within, and Last year (actual) — what actually shipped in those same weeks, twelve months back. "Same weeks" means Skuvelo lines up by the calendar week's Monday, so a seasonal spike lines up with last year's spike instead of sliding a few days off. If a month shows a dash instead of a number, that's not a zero-sales month — it means Skuvelo doesn't have shipment history that far back yet for that product. Hover the dash to see the exact date your history starts. Hover any known Last year figure to see how this year's forecast compares — for example, "forecast +15% vs last year" — so you don't have to do the subtraction yourself. The item page's week-by-week table carries the same Last year figure per week, right next to that week's actual sales and forecast range, for whenever you want the detail behind a single SKU rather than a whole product type.
Try the plan on your own stock.
Start a trial with your own sales and stock, or look around the live demo first.